I hear every day
from investors that Canadian banks are solid and will never fail, but
when I ask why, the answers I get are mostly based on the simple fact
that we Canadians believe in our banks more than we should. Canadians
somehow think Canada’s banks are the gold standard for the banking
system worldwide for one reason: their performance. Sure, Canadian
banks have performed better than their peers. They have sold off, but
nothing compared to what’s happening to banks in Europe and U.S., which
are getting hammered.
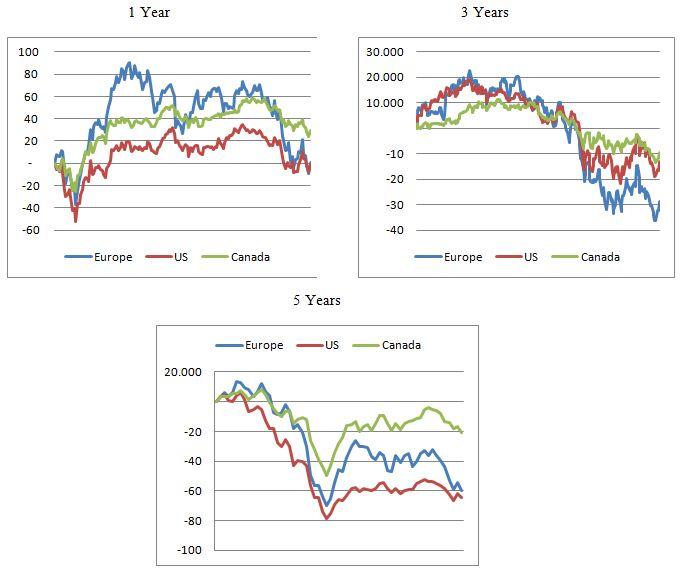
But can performance alone be a reliable measurement? The charts below compare the Thomson Reuters Europe banking & Investment Services (EUPUF1-TX), the S&P 500 financials (SPSF) and the S&P/TSX Capped Financials (T.TFS-T). Banks in Europe performed better for most of the time before dipping below Canadian and U.S. banks, and U.S. banks were the most profitable before they collapsed in 2008. This shows that performance alone is not a reliable measure of the banks’ strengths.
click to enlarge
The charts above show how banking sectors move together and how relying on their share price alone is not enough. To get a clearer picture, we shall look at how much help these banks received, stress tests results, tangible common equity ratios, borrowers’ concentration, and asset and geographic diversification. Maybe then we’ll be able to say Canadian banks are the best.
Bailouts
Most Canadians don’t know or have forgotten that Canadian banks have also been bailed out just like their European and U.S. cousins. The details of the bailouts in most cases were kept secret and were downplayed by the media and the government. That has helped the banks hold their value better than the much more publicised banking bailout of U.S. and Europe. During the financial crisis, the large six Canadian banks have lost over $20B and have received $186B in the form of asset transfer in exchange for cash.
Some came from the Canadian Government, but most of it came from the U.S. Government. Those same banks argue that it wasn’t a bailout, but a purchase of assets. Calling it a purchase of assets, an asset transfer, or a cash injection doesn’t make a difference. Bottom line is the government stepped in to purchase assets above market value, and if they hadn’t those banks would`ve been in big trouble.
Stress Tests
Even the so-called stress tests were kept secret, and the justification for that was that the Canadian banking regulators didn’t want to get involved in what it sees as a PR exercise. Which makes me wonder, why haven’t the banks released those results? If they are so good, why haven’t they used them to their advantage? After all, European and American Banks have benefited – even for a short period – from the release of these results, which have triggered an increase in consumer “confidence” in the banks and caused their stocks to rally. Unfortunately for trigger-happy investors, confidence was short lived, as some of the banks that passed the tests required bailout a couple of months, or even weeks, after stress test result came out.
Dexia (DXBGY.PK), one of the largest banks in Europe and the highest scorer on these tests (table 1), had to be dismantled over the weekend to avoid market panic.
Tier 1 capital is the minimum amount of capital that a bank must have –
equity capital and declared reserves – plus preferred equity (It
varies depending on the jurisdiction). It’s the most widely used ratio
to measure banks strength. The minimum tier 1 capital for Canada and
the U.S. is 4% while it’s 4.4% in Europe. Stress tests were supposed to
test the banks’ strength using their tier 1 capital ratio under
different worst case scenarios, and apparently in the case of Europe
this year the scenarios ignored risks associated with government debts.
So let’s just look at how world banks compare in terms of their tier 1
and see if they have increased their requirement as they are supposed
to.
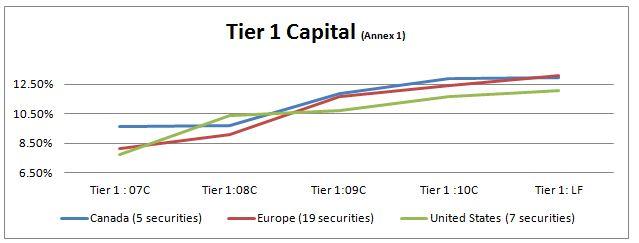
This chart shows that European and Canadian banks are very close, and although the former have been lagging, the latter caught up and overtook it in the most recent filing. So where does the argument of Canadian banks being well capitalized come from? Well capitalized compared to what? Even if you compare them to U.S. banks they still don’t look that much better.
Banking Sector Strength
The two other widely used ratios to measure the banks’ strength are the TCE and TCE to RWA:
The tangible common equity ratio (TCE) is a ratio used to determine how much losses a bank can take before shareholder equity is wiped out. It is calculated by taking the value of the company’s total equity and subtracting intangible assets (value might be questionable), goodwill and preferred stock equity and then dividing by the value of the company’s tangible assets, with tangible assets being the company’s total assets less goodwill and intangibles.
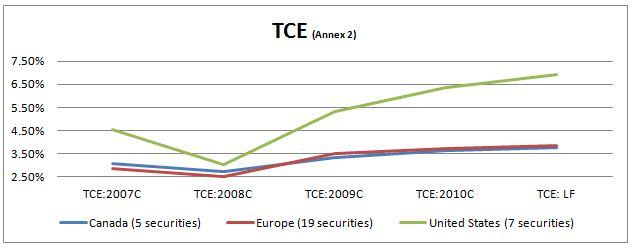
It is clear from the chart that European banks have a higher ratio than Canadian ones, with the U.S. ones way higher. The problem of using this ratio is that it assumes the same level of risk for all the assets, whether they are bonds from Greece or from Norway. But because no one can verify the assets of banks it just seems normal to compare them in the same way.
The tangible common equity to risk-weighted assets (TCE to RWA) on the other hand is based on the riskiness of the assets held. Government bonds for example are deemed less risky than consumer loans. The problem with this ratio though is that it is greatly influenced by how the banks evaluate the risk of their assets, which leaves big room for interpretations.
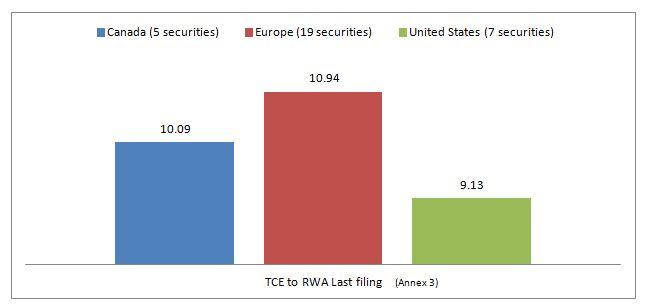
This means that the Canadian banking sector is even more leveraged, and has as little as or even fewer tangible assets than the European banking sector, despite supposedly tougher regulation. In fact, the most recent sign of their weakness is the announcement made by the banking regulators last week of increasing the bank’s capital requirements.
Banking Sector Diversification
1. Geographic Diversification
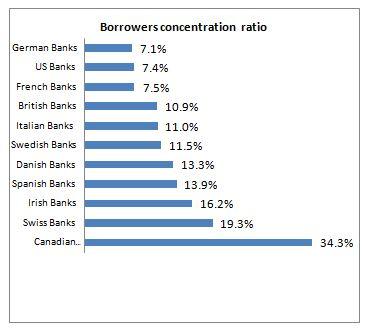
Let’s see how Canadian banks rank in terms of Borrowers' concentration ratio, which measures the diversification of bank exposure to other countries in terms of lending. The ratio is calculated using the Herfindahl Index, which measures the concentration of a country’s top ten borrowers; it’s also a great tool to analyze banks vulnerability for contagion effects.
Being exposed to one or a few countries increases the risk of contagion. Based on a research done by Deutsche Bank, Canadian banks have a higher borrower’s concentration than their American and European peers. Due to geographic proximity, limited growth opportunities in domestic markets and “strict” regulations preventing domestic mergers, Canadian banks have large exposure to the U.S.
Among the big five Canadian banks, Toronto-Dominion Bank (TD) has the largest presence in the U.S. market and has more branches in the U.S. than in Canada. Further decline in the U.S. economy extends beyond affecting our exports to affecting our financial sector stability. So as the European banks are in a bad spot by holding some toxic government debt, Canadian banks are in an even worst spot by being exposed to an economy that is swimming in debt and is in decline.
Source: Morning Cross-border exposure, Deutsche bank research.
Comparing all these ratios seems enough to judge, but knowing that there are so many factors influencing those results, the secretive nature of the banking sectors, and the huge differences in the environments in which these banks operate it becomes less clear which ones are really better. So enough comparisons for now and let’s look at how Canadian banks are doing in terms of their asset diversification.
2. Asset Diversification
Canadian banks, unlike others, are heavily concentrated on one asset class, real estate. With home prices higher than pre-crisis levels, artificially record low interest rates and the increasing availability of credit encouraged by the government to boost growth, it is easy to see where this is heading. The next chart assesses the risks of a decline in real estate prices. It tracks two measures of valuation. The first is the price-to-income ratio, a gauge of affordability. The second is the price-to-rent ratio, a measure of benefits from home ownership: namely the rents earned by property investors (or those saved by owner-occupiers).
Canada’s 27% increase in home prices is the highest among developed countries since 2007; Canadian rent is the most overvalued as well. Both of these measures are well above their long-term average, which has been calculated since 1975. This could signal that property is overvalued. Real estate doesn’t increase forever, especially if the economy isn’t. Canada’s unemployment is on the hike and the GDP growth is very low at times and negative at other times.
It is now much easier to get a mortgage than to get a loan to start a business and real estate investments are wrongly considered a safer investment than equities, which is leading to more capital flowing through real estate than through businesses and leading to much larger growth in the real estate market than in other industries.
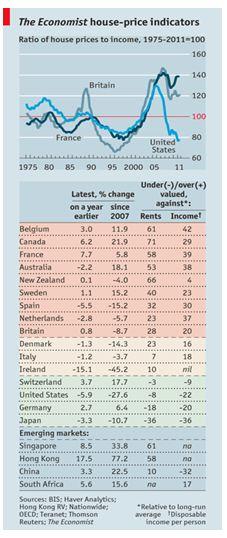
Source: http://www.economist.com/node/21540231
Another worrying factor is the high exposure to unsecured consumer debt. A new report by Moody’s found that this unsecured debt represent 9% to 15% of total managed assets. Add uninsured mortgages, and the total uninsured total debt becomes 14% to 24% of total managed assets.
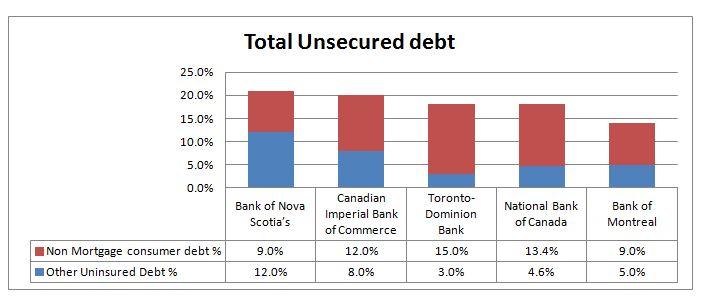
Source: www.moodys.com/research/Moodys-Mortgage
With these numbers in mind, it is fair to conclude that in the event of another economic downturn, Canadian banks could be adversely exposed to high levels of unsecured consumer debt, and would face substantial loses. An interest rate hike coupled with tighter credit conditions would mean that Canadians who could barely afford their mortgage won’t be able to repay it, especially with Canadian consumers increasing their leverage ratio, and household debt standing at 150% of disposable income as of June 2011. A correction in the housing market will follow, pushing more to walk away from their mortgages as the value of their homes drops. Eventually this would lead the banks to take massive write-downs on their mortgage portfolios too.
Bottom line: If you consider all these factors and the current economic environment we live in, but think that Canadians will keep up their payments no matter what, then you can invest in banks. But if you think that what happened to other banks can happen to Canada’s banks, that borrowers will not honour their payments if they don’t have a job, or that there are way too many unknowns, then stay away from the banks, you have invested enough by having your money deposited there.
Sources: All graphs are from my Bloomberg terminal (annexes below), borrowers concentration from Deutsche bank research (not available online). Unsecured dept from Moody's, housing chart from the Economist.
Annex1: Banks tier one ratio from 2007 to latest filing (LF)
Annex 2: Banks Tangible common equity ratio.
Annex 3: Tangible common equity to risk weighted assets (TCE to RWA) last filing.
Disclosure: I have no positions in any stocks mentioned, and no plans to initiate any positions within the next 72 hours.
But can performance alone be a reliable measurement? The charts below compare the Thomson Reuters Europe banking & Investment Services (EUPUF1-TX), the S&P 500 financials (SPSF) and the S&P/TSX Capped Financials (T.TFS-T). Banks in Europe performed better for most of the time before dipping below Canadian and U.S. banks, and U.S. banks were the most profitable before they collapsed in 2008. This shows that performance alone is not a reliable measure of the banks’ strengths.
click to enlarge
The charts above show how banking sectors move together and how relying on their share price alone is not enough. To get a clearer picture, we shall look at how much help these banks received, stress tests results, tangible common equity ratios, borrowers’ concentration, and asset and geographic diversification. Maybe then we’ll be able to say Canadian banks are the best.
Bailouts
Most Canadians don’t know or have forgotten that Canadian banks have also been bailed out just like their European and U.S. cousins. The details of the bailouts in most cases were kept secret and were downplayed by the media and the government. That has helped the banks hold their value better than the much more publicised banking bailout of U.S. and Europe. During the financial crisis, the large six Canadian banks have lost over $20B and have received $186B in the form of asset transfer in exchange for cash.
Some came from the Canadian Government, but most of it came from the U.S. Government. Those same banks argue that it wasn’t a bailout, but a purchase of assets. Calling it a purchase of assets, an asset transfer, or a cash injection doesn’t make a difference. Bottom line is the government stepped in to purchase assets above market value, and if they hadn’t those banks would`ve been in big trouble.
Stress Tests
Even the so-called stress tests were kept secret, and the justification for that was that the Canadian banking regulators didn’t want to get involved in what it sees as a PR exercise. Which makes me wonder, why haven’t the banks released those results? If they are so good, why haven’t they used them to their advantage? After all, European and American Banks have benefited – even for a short period – from the release of these results, which have triggered an increase in consumer “confidence” in the banks and caused their stocks to rally. Unfortunately for trigger-happy investors, confidence was short lived, as some of the banks that passed the tests required bailout a couple of months, or even weeks, after stress test result came out.
Dexia (DXBGY.PK), one of the largest banks in Europe and the highest scorer on these tests (table 1), had to be dismantled over the weekend to avoid market panic.
| |||||||||||||||||||||||||||||||||||||||||||||||||||||||||||
This chart shows that European and Canadian banks are very close, and although the former have been lagging, the latter caught up and overtook it in the most recent filing. So where does the argument of Canadian banks being well capitalized come from? Well capitalized compared to what? Even if you compare them to U.S. banks they still don’t look that much better.
Banking Sector Strength
The two other widely used ratios to measure the banks’ strength are the TCE and TCE to RWA:
The tangible common equity ratio (TCE) is a ratio used to determine how much losses a bank can take before shareholder equity is wiped out. It is calculated by taking the value of the company’s total equity and subtracting intangible assets (value might be questionable), goodwill and preferred stock equity and then dividing by the value of the company’s tangible assets, with tangible assets being the company’s total assets less goodwill and intangibles.
It is clear from the chart that European banks have a higher ratio than Canadian ones, with the U.S. ones way higher. The problem of using this ratio is that it assumes the same level of risk for all the assets, whether they are bonds from Greece or from Norway. But because no one can verify the assets of banks it just seems normal to compare them in the same way.
The tangible common equity to risk-weighted assets (TCE to RWA) on the other hand is based on the riskiness of the assets held. Government bonds for example are deemed less risky than consumer loans. The problem with this ratio though is that it is greatly influenced by how the banks evaluate the risk of their assets, which leaves big room for interpretations.
This means that the Canadian banking sector is even more leveraged, and has as little as or even fewer tangible assets than the European banking sector, despite supposedly tougher regulation. In fact, the most recent sign of their weakness is the announcement made by the banking regulators last week of increasing the bank’s capital requirements.
Banking Sector Diversification
1. Geographic Diversification
Let’s see how Canadian banks rank in terms of Borrowers' concentration ratio, which measures the diversification of bank exposure to other countries in terms of lending. The ratio is calculated using the Herfindahl Index, which measures the concentration of a country’s top ten borrowers; it’s also a great tool to analyze banks vulnerability for contagion effects.
Being exposed to one or a few countries increases the risk of contagion. Based on a research done by Deutsche Bank, Canadian banks have a higher borrower’s concentration than their American and European peers. Due to geographic proximity, limited growth opportunities in domestic markets and “strict” regulations preventing domestic mergers, Canadian banks have large exposure to the U.S.
Among the big five Canadian banks, Toronto-Dominion Bank (TD) has the largest presence in the U.S. market and has more branches in the U.S. than in Canada. Further decline in the U.S. economy extends beyond affecting our exports to affecting our financial sector stability. So as the European banks are in a bad spot by holding some toxic government debt, Canadian banks are in an even worst spot by being exposed to an economy that is swimming in debt and is in decline.
Source: Morning Cross-border exposure, Deutsche bank research.
Comparing all these ratios seems enough to judge, but knowing that there are so many factors influencing those results, the secretive nature of the banking sectors, and the huge differences in the environments in which these banks operate it becomes less clear which ones are really better. So enough comparisons for now and let’s look at how Canadian banks are doing in terms of their asset diversification.
2. Asset Diversification
Canadian banks, unlike others, are heavily concentrated on one asset class, real estate. With home prices higher than pre-crisis levels, artificially record low interest rates and the increasing availability of credit encouraged by the government to boost growth, it is easy to see where this is heading. The next chart assesses the risks of a decline in real estate prices. It tracks two measures of valuation. The first is the price-to-income ratio, a gauge of affordability. The second is the price-to-rent ratio, a measure of benefits from home ownership: namely the rents earned by property investors (or those saved by owner-occupiers).
Canada’s 27% increase in home prices is the highest among developed countries since 2007; Canadian rent is the most overvalued as well. Both of these measures are well above their long-term average, which has been calculated since 1975. This could signal that property is overvalued. Real estate doesn’t increase forever, especially if the economy isn’t. Canada’s unemployment is on the hike and the GDP growth is very low at times and negative at other times.
It is now much easier to get a mortgage than to get a loan to start a business and real estate investments are wrongly considered a safer investment than equities, which is leading to more capital flowing through real estate than through businesses and leading to much larger growth in the real estate market than in other industries.
Source: http://www.economist.com/node/21540231
Another worrying factor is the high exposure to unsecured consumer debt. A new report by Moody’s found that this unsecured debt represent 9% to 15% of total managed assets. Add uninsured mortgages, and the total uninsured total debt becomes 14% to 24% of total managed assets.
Source: www.moodys.com/research/Moodys-Mortgage
With these numbers in mind, it is fair to conclude that in the event of another economic downturn, Canadian banks could be adversely exposed to high levels of unsecured consumer debt, and would face substantial loses. An interest rate hike coupled with tighter credit conditions would mean that Canadians who could barely afford their mortgage won’t be able to repay it, especially with Canadian consumers increasing their leverage ratio, and household debt standing at 150% of disposable income as of June 2011. A correction in the housing market will follow, pushing more to walk away from their mortgages as the value of their homes drops. Eventually this would lead the banks to take massive write-downs on their mortgage portfolios too.
Bottom line: If you consider all these factors and the current economic environment we live in, but think that Canadians will keep up their payments no matter what, then you can invest in banks. But if you think that what happened to other banks can happen to Canada’s banks, that borrowers will not honour their payments if they don’t have a job, or that there are way too many unknowns, then stay away from the banks, you have invested enough by having your money deposited there.
Sources: All graphs are from my Bloomberg terminal (annexes below), borrowers concentration from Deutsche bank research (not available online). Unsecured dept from Moody's, housing chart from the Economist.
Annex1: Banks tier one ratio from 2007 to latest filing (LF)
| Banks | Tier 1 : 07C | Tier 1:08C | Tier 1:09C | Tier 1 :10C | Tier 1: LF |
| Canada (5 securities) | |||||
| BANK OF MONTREAL (BMO) | 9.51% | 9.77% | 12.24% | 13.45% | 11.48% |
| TORONTO-DOMINION BANK (TD) | 10.30% | 9.80% | 11.30% | 12.20% | 13.00% |
| ROYAL BANK OF CANADA (RY) | 9.40% | 9.00% | 13.00% | 13.00% | 13.30% |
| BANK OF NOVA SCOTIA (BNS) | 9.30% | 9.30% | 10.70% | 11.80% | 12.20% |
| CAN IMPERIAL BK OF COMMERCE (CM) | 9.70% | 10.50% | 12.10% | 13.90% | 14.70% |
| 9.64% | 9.67% | 11.87% | 12.87% | 12.94% | |
| Europe (19 securities) | |||||
| DEUTSCHE BANK AG-REGISTERED (DB) | 8.60% | 10.10% | 12.60% | 12.30% | 13.80% |
| CREDIT SUISSE GROUP AG-REG (CS) | 10.00% | 13.30% | 16.30% | 17.20% | 17.70% |
| BNP PARIBAS (BNP) | 7.30% | 7.80% | 10.10% | 11.40% | 11.90% |
| BARCLAYS PLC (BCS) | 7.80% | 8.60% | 13.00% | 13.50% | 13.50% |
| UBS AG-REG (UBS) | 9.10% | 11.00% | 15.40% | 17.80% | 18.40% |
| SOCIETE GENERALE (SCGLY.PK) | 6.62% | 8.80% | 10.70% | 10.60% | 11.30% |
| DANSKE BANK A/S (DNSKY.PK) | 6.42% | 9.20% | 14.10% | 14.80% | 16.00% |
| NORDEA BANK AB (NRBAY.PK) | 8.30% | 9.30% | 11.40% | 11.40% | 12.10% |
| SVENSKA HANDELSBANKEN-A (SVNLY.PK) | 10.60% | 10.50% | 14.20% | 16.50% | 17.40% |
| UNICREDIT SPA (UNCIF.PK) | 6.55% | 6.66% | 8.63% | 9.46% | 9.12% |
| BANCO SANTANDER SA (STD) | 7.71% | 9.10% | 10.10% | 10.00% | 10.74% |
| LLOYDS BANKING GROUP PLC (LYG) | 9.50% | 8.00% | 9.60% | 11.60% | 11.60% |
| ROYAL BANK OF SCOTLAND (RBS) | 7.30% | 10.00% | 14.10% | 12.90% | 13.50% |
| SWEDBANK AB - A SHARES (SWDBY.PK) | 8.50% | 10.60% | 13.50% | 15.20% | 16.60% |
| HSBC HOLDINGS PLC (HBC) | 8.70% | 8.30% | 10.80% | 12.10% | 12.20% |
| BANCO BILBAO VIZCAYA (BVA) | 7.30% | 7.90% | 9.40% | 10.50% | 9.80% |
| DNB ASA (DNBHF.PK) | 7.60% | 6.70% | 9.30% | 10.10% | 9.00% |
| ALLIED IRISH BANKS PLC (AIB) | 7.50% | 7.40% | 7.20% | 4.30% | 9.70% |
| STANDARD CHARTERED PLC (SCBFF.PK) | 8.80% | 9.90% | 11.50% | 14.00% | 13.90% |
| 8.12% | 9.11% | 11.68% | 12.40% | 13.07% | |
| United States (7 securities) | |||||
| PNC FINANCIAL SERVICES GROUP (PNC) | 6.80% | 9.70% | 11.40% | 12.10% | 13.10% |
| CITIGROUP INC (C) | 7.12% | 11.92% | 11.67% | 12.91% | 13.45% |
| WELLS FARGO & CO (WFC) | 7.59% | 7.84% | 9.25% | 11.16% | 11.26% |
| BB&T CORP (BBT) | 9.10% | 12.30% | 11.50% | 11.80% | 12.50% |
| US BANCORP (USB) | 8.30% | 10.60% | 9.60% | 10.50% | 10.80% |
| BANK OF AMERICA CORP (BAC) | 6.87% | 9.15% | 10.40% | 11.24% | 11.48% |
| JPMORGAN CHASE & CO (JPM) | 8.40% | 10.90% | 11.10% | 12.10% | 12.10% |
| 7.74% | 10.34% | 10.70% | 11.69% | 12.10% |
| Banks | TCE:2007C | TCE:2008C | TCE:2009C | TCE:2010C | TCE: LF |
| Canada (5 securities) | |||||
| BANK OF MONTREAL (BMO) | 3.51% | 3.46% | 3.99% | 4.12% | 4.08% |
| TORONTO-DOMINION BANK (TD) | 2.66% | 2.17% | 3.29% | 3.71% | 4.03% |
| ROYAL BANK OF CANADA (RY) | 2.86% | 2.37% | 3.37% | 3.59% | 3.65% |
| BANK OF NOVA SCOTIA (BNS) | 3.84% | 3.21% | 3.57% | 3.83% | 3.65% |
| CAN IMPERIAL BK OF COMMERCE (CM) | 2.62% | 2.47% | 2.54% | 2.89% | 3.43% |
| 3.10% | 2.73% | 3.35% | 3.63% | 3.77% | |
| Europe (19 securities) | |||||
| DEUTSCHE BANK AG-REGISTERED (DB) | 1.38% | 0.95% | 1.78% | 1.76% | - |
| CREDIT SUISSE GROUP AG-REG (CS) | 2.36% | 1.94% | 2.94% | 2.59% | 2.46% |
| BNP PARIBAS (BNP) | 2.09% | 1.45% | 1.83% | 2.66% | 2.85% |
| BARCLAYS PLC (BCS) | 1.23% | 1.28% | 2.81% | 2.85% | 2.90% |
| UBS AG-REG (UBS) | 0.99% | 0.98% | 2.26% | 2.83% | 2.95% |
| SOCIETE GENERALE (SCGLY.PK) | 1.95% | 1.95% | 2.71% | 2.75% | 2.96% |
| DANSKE BANK A/S (DNSKY.PK) | 2.26% | 2.08% | 2.52% | 2.56% | 3.07% |
| NORDEA BANK AB (NRBAY.PK) | 3.72% | 3.22% | 3.84% | 3.68% | 3.25% |
| SVENSKA HANDELSBANKEN (SVNLY.PK) | 3.68% | 3.16% | 3.58% | 3.80% | 3.43% |
| UNICREDIT SPA (UNCIF.PK) | 3.16% | 2.80% | 3.75% | 4.27% | 3.52% |
| BANCO SANTANDER SA (STD) | 4.08% | 3.57% | 3.94% | 3.95% | 3.81% |
| LLOYDS BANKING GROUP PLC (LYG) | 2.75% | 1.60% | 3.64% | 4.11% | 4.07% |
| ROYAL BANK OF SCOTLAND (RBS) | 0.17% | 1.63% | 3.57% | 4.22% | 4.20% |
| SWEDBANK AB - A SHARES (SWDBY.PK) | 3.01% | 3.72% | 4.06% | 4.65% | 4.34% |
| HSBC HOLDINGS PLC (HBC) | 3.72% | 2.65% | 4.10% | 4.74% | 4.82% |
| BANCO BILBAO VIZCAYA (BVA) | 3.81% | 3.22% | 4.18% | 5.12% | 4.89% |
| DNB ASA (DNBHF.PK) | 4.47% | 3.76% | 5.01% | 5.61% | 4.90% |
| ALLIED IRISH BANKS PLC (AIB) | 4.91% | 4.24% | 5.50% | 2.23% | 5.29% |
| STANDARD CHARTERED PLC (SCBFF.PK) | 4.48% | 3.68% | 4.82% | 6.13% | 5.99% |
| 2.85% | 2.52% | 3.52% | 3.71% | 3.87% | |
| United States (7 securities) | |||||
| PNC FINANCIAL SERVICES GROUP (PNC) | 4.61% | 2.74% | 4.37% | 8.05% | 8.65% |
| CITIGROUP INC (C) | 3.11% | 1.56% | 6.49% | 6.89% | 7.60% |
| WELLS FARGO & CO (WFC) | 5.93% | 2.33% | 5.44% | 6.72% | 7.22% |
| BB&T CORP (BBT) | 5.47% | 4.75% | 5.97% | 6.27% | 6.84% |
| US BANCORP (USB) | 4.74% | 3.19% | 5.10% | 5.22% | 6.40% |
| BANK OF AMERICA CORP (BAC) | 3.35% | 2.83% | 4.50% | 5.86% | 6.13% |
| JPMORGAN CHASE & CO (JPM) | 4.76% | 3.83% | 5.27% | 5.59% | 5.49% |
| 4.57% | 3.03% | 5.30% | 6.37% | 6.91% |
| Banks | |
| Canada (5 securities) | |
| BANK OF MONTREAL (BMO) | 9.64 |
| TORONTO-DOMINION BANK (TD) | 12.35 |
| ROYAL BANK OF CANADA (RY) | 10.11 |
| BANK OF NOVA SCOTIA (BNS) | 8.85 |
| CAN IMPERIAL BK OF COMMERCE (CM) | 9.48 |
| 10.09 | |
| Europe (19 securities) | |
| DEUTSCHE BANK AG-REGISTERED (DB) | 9.60 |
| CREDIT SUISSE GROUP AG-REG (CS) | 12.13 |
| BNP PARIBAS (BNP) | 11.90 |
| BARCLAYS PLC (BCS) | 10.59 |
| UBS AG-REG (UBS) | 18.60 |
| SOCIETE GENERALE (SCGLY.PK) | 9.22 |
| DANSKE BANK A/S (DNSKY.PK) | 9.69 |
| NORDEA BANK AB (NRBAY.PK) | 11.47 |
| SVENSKA HANDELSBANKEN-A (SVNLY.PK) | 15.31 |
| UNICREDIT SPA (UNCIF.PK) | 8.49 |
| BANCO SANTANDER SA (STD) | 7.76 |
| LLOYDS BANKING GROUP PLC (LYG) | 9.98 |
| ROYAL BANK OF SCOTLAND (RBS) | 13.04 |
| SWEDBANK AB - A SHARES (SWDBY.PK) | 14.62 |
| HSBC HOLDINGS PLC (HBC) | 10.43 |
| BANCO BILBAO VIZCAYA (BVA) | 8.91 |
| DNB ASA (DNBHF.PK) | 10.12 |
| ALLIED IRISH BANKS PLC (AIB) | 3.27 |
| STANDARD CHARTERED PLC (SCBFF.PK) | 12.74 |
| 10.94 | |
| United States (7 securities) | |
| PNC FINANCIAL SERVICES GROUP (PNC) | 9.50 |
| CITIGROUP INC (C) | 13.25 |
| WELLS FARGO & CO (WFC) | 8.39 |
| BB&T CORP (BBT) | 7.96 |
| US BANCORP (USB) | 6.23 |
| BANK OF AMERICA CORP (BAC) | 8.78 |
| JPMORGAN CHASE & CO (JPM) | 9.82 |
| 9.13 |